Sales Report
A sales report gives an overview of the state of the sales activities within a company. It shows the different trends happening and the sales volume over a specified time, but also analyses the performance of your business, staff, and clients.
The OMS platform can give you a snapshot of your business performance at a specific moment in time ‘real time data’ and can be accessed online at a time and place that suits you.
Each report can be generated for a period of your choosing i.e., yearly, monthly, weekly, daily, and is available within a matter of seconds, depending on your current internet speed.
If you are in a hurry to present your sales data at your next meeting, all graphs / charts displayed on the platform can be easily downloaded to a file format that you require.
Some of the sales reports that can be generated in the OMS platform include:
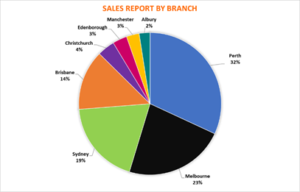
Branch Report
Will highlight the percentage of sales by branch / location, for a particular period, giving you a comparative overview of each location’s sales data.
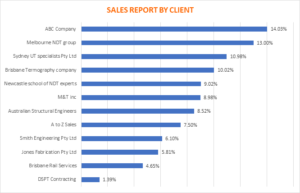
Client Report
Will highlight the percentage of sales by client, enabling managers to determine where to concentrate efforts in a particular area.
Personnel Report
Will highlight the percentage of sales per staff member and will analyse each employee’s sales performance in general assisting managers and staff to keep track of their KPI’s and improve performance.

Section Report
Will highlight the sales by test method enabling you to easily distinguish what test methods are providing the most sales in a particular time frame.

Financial Year Report
Will provide an overview of how your business is tracking compared to the past financial year.

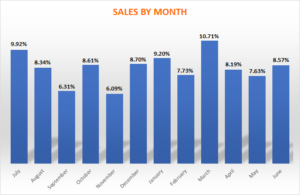
Monthly Report
Will provide a average monthly percentage of sales for a particular time period.